arcuate artery
9 results found
-
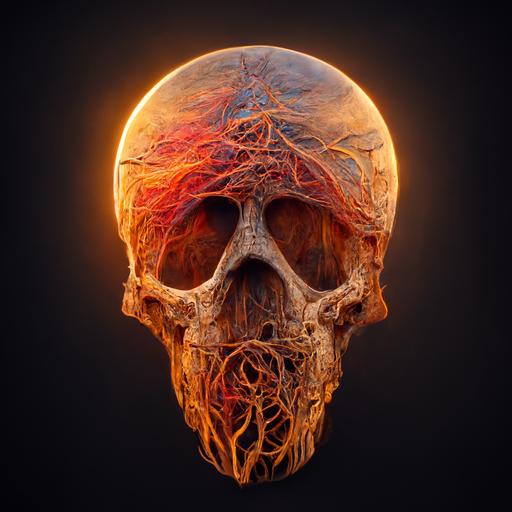
Prompt: human face anatomy diagram skull arteries in smoky sunset light 6k
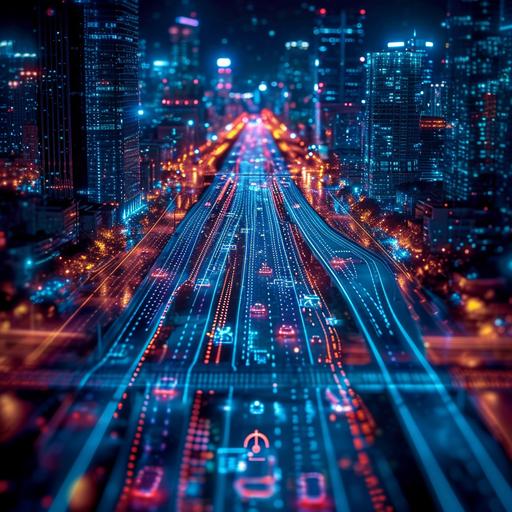
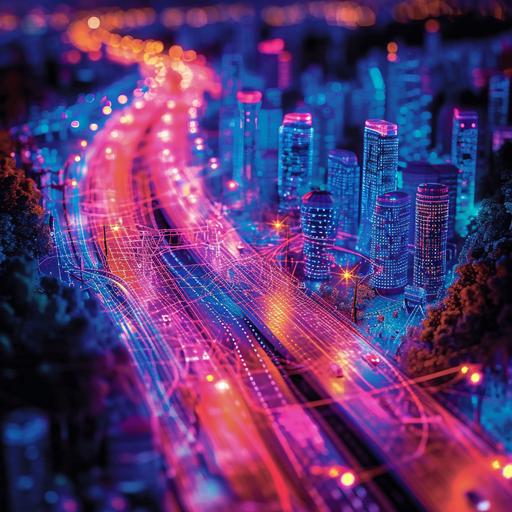
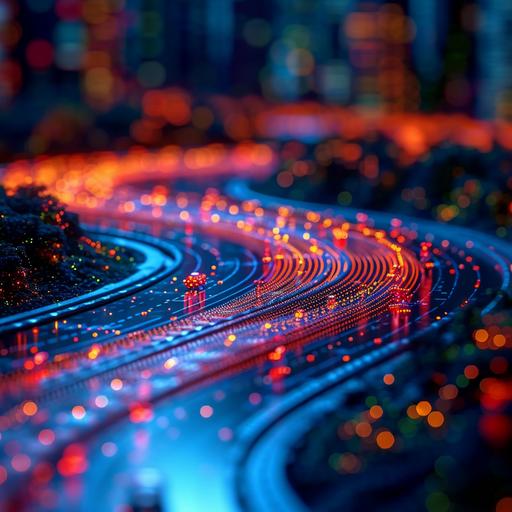
Prompt: Visualize a wireframe hologram of an advanced urban transportation network for a bustling The hologram displays a complex grid of streets, underground tunnels, and skyways. High-speed trains, autonomous vehicles, and drones are represented as moving lines and shapes, flowing seamlessly through the city's arteries. Key hubs and intersections pulsate with brighter colors, indicating high traffic and activity --s 750 --v 6.0
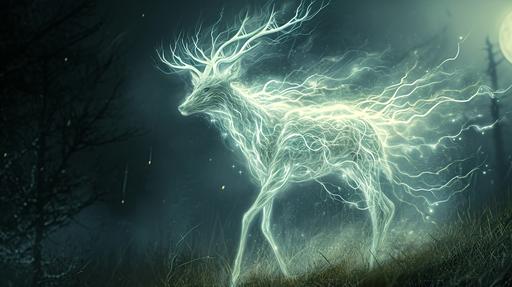
Prompt: Create an image of a mystical hybrid creature known as 'Yuuuyc-Luminogramfolk'. This being combines the structured, meticulous appearance of a 'Yuuuyc' (Zgjaiu-Ycobyo) with the ethereal, glowing attributes of Luminogramfolk. It maintains the robust, muscular form and visible arteries of the Yuuuyc, but with an intricate pattern of light and shadow overlaying its body, giving it a luminous quality. The creature's fur and skin, though well-groomed, radiate with an inner light, creating an aura of eerie elegance. The setting is a serene, yet mystical environment, where the hybrid's blend of orderliness and luminous nature is highlighted by subtle moonlight and its own radiant glow. --ar 16:9 --v 6.0
-
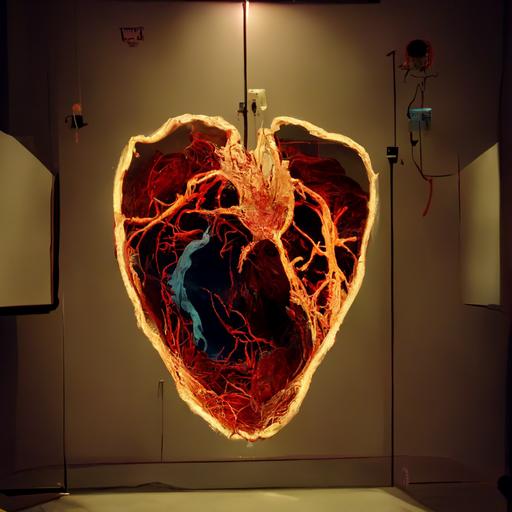
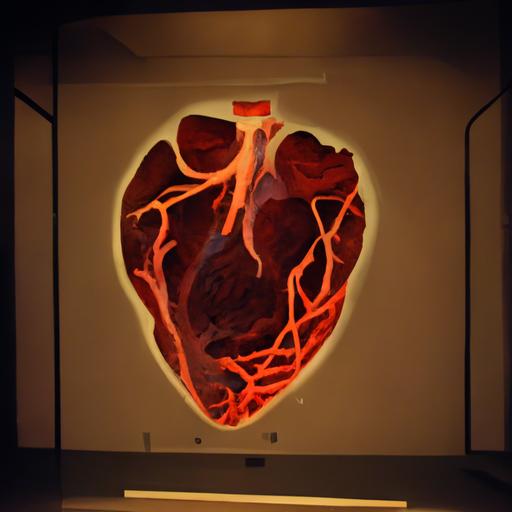
Prompt: An opreating room,where a number of doctors perform cardiac catheterization for a specific patient, and there is a medical screen powered by artificial intellignce that doing a full scan of the heart,and then shows it as a very accurate 3D model shape realistic, talking to the doctor telling him the number of the patient's cardiac arteries,the length and size of these minute arteries,the width and area of these arteries, and the distance between each artery and the next as a very accurate 3D model shape realistic and the number of heart attacks detected in these arteries, in addition to the thickness, size and loctions of these heart clots,and how to access it using geospatial intelligence systemes through several paths with the least cost of time and effort,and without obstacles, then tell the doctor which path is the best based on these conditions ,then this information appears in the form of a large dashboard divided into several many many parts, each part showing this information either in 3D realistic form or in the form of 4D model shape realistic maps or both , with a number of statistical indicators showing the percentage of strokes such as colmns , others is indicated by the percentage show the probability of survival, like bar graphs and very accurate graphed relative circles 3D model shape realistic
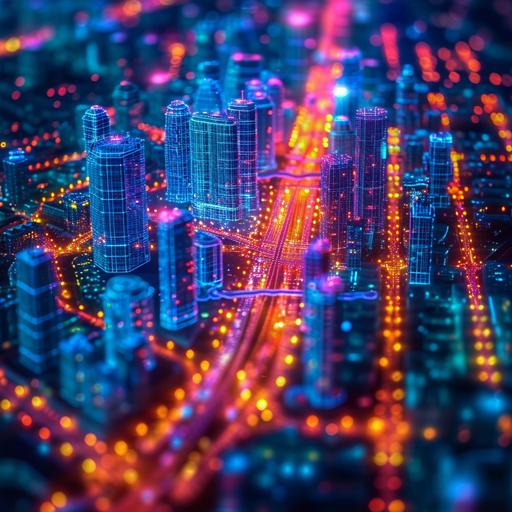
Prompt: Visualize a wireframe hologram of an advanced urban transportation network for a bustling The hologram displays a complex grid of streets, underground tunnels, and skyways. High-speed trains, autonomous vehicles, and drones are represented as moving lines and shapes, flowing seamlessly through the city's arteries. Key hubs and intersections pulsate with brighter colors, indicating high traffic and activity --s 750 --v 6.0
-
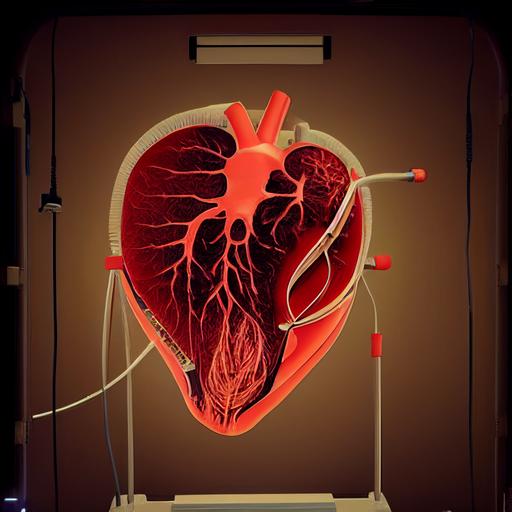
Prompt: An opreating room,where a number of doctors perform cardiac catheterization for a specific patient, and there is a medical screen powered by artificial intellignce that doing a full scan of the heart,and then shows it as a very accurate 3D model shape realistic, talking to the doctor telling him the number of the patient's cardiac arteries,the length and size of these minute arteries,the width and area of these arteries, and the distance between each artery and the next as a very accurate 3D model shape realistic and the number of heart attacks detected in these arteries, in addition to the thickness, size and loctions of these heart clots,and how to access it using geospatial intelligence systemes through several paths with the least cost of time and effort,and without obstacles, then tell the doctor which path is the best based on these conditions ,then this information appears in the form of a large dashboard divided into several many many parts, each part showing this information either in 3D realistic form or in the form of 4D model shape realistic maps or both , with a number of statistical indicators showing the percentage of strokes such as colmns , others is indicated by the percentage show the probability of survival, like bar graphs and very accurate graphed relative circles 3D model shape realistic --uplight
Prompt: Visualize a wireframe hologram of an advanced urban transportation network for a bustling The hologram displays a complex grid of streets, underground tunnels, and skyways. High-speed trains, autonomous vehicles, and drones are represented as moving lines and shapes, flowing seamlessly through the city's arteries. Key hubs and intersections pulsate with brighter colors, indicating high traffic and activity --s 750 --v 6.0
-
Prompt: An opreating room,where a number of doctors perform cardiac catheterization for a specific patient, and there is a medical screen powered by artificial intellignce that doing a full scan of the heart,and then shows it as a very accurate 3D model shape realistic, talking to the doctor telling him the number of the patient's cardiac arteries,the length and size of these minute arteries,the width and area of these arteries, and the distance between each artery and the next as a very accurate 3D model shape realistic and the number of heart attacks detected in these arteries, in addition to the thickness, size and loctions of these heart clots,and how to access it using geospatial intelligence systemes through several paths with the least cost of time and effort,and without obstacles, then tell the doctor which path is the best based on these conditions ,then this information appears in the form of a large dashboard divided into several many many parts, each part showing this information either in 3D realistic form or in the form of 4D model shape realistic maps or both , with a number of statistical indicators showing the percentage of strokes such as colmns , others is indicated by the percentage show the probability of survival, like bar graphs and very accurate graphed relative circles 3D model shape realistic --test --creative --upbeta
Prompt: Visualize a wireframe hologram of an advanced urban transportation network for a bustling The hologram displays a complex grid of streets, underground tunnels, and skyways. High-speed trains, autonomous vehicles, and drones are represented as moving lines and shapes, flowing seamlessly through the city's arteries. Key hubs and intersections pulsate with brighter colors, indicating high traffic and activity --s 750 --v 6.0