numerical data
260 results found
-

Prompt: a shape of cloud made with numerous post-its on the board

Prompt: a cube logo of a data with data waves inside of the cube, simple, vector, no shading detail, no dimesion, simple, minimalist --v 6.0 --s 50 --ar 3:2
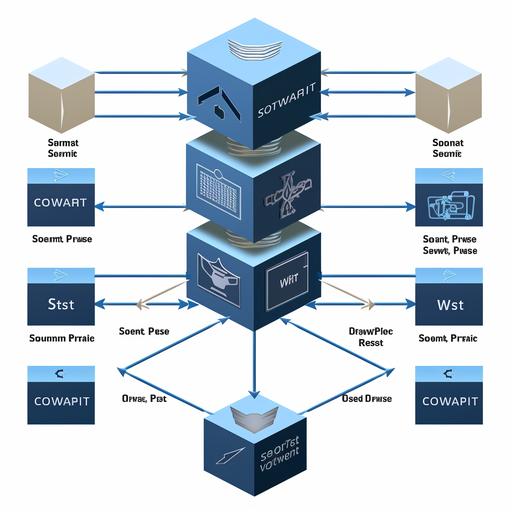
Prompt: a system architecture diagram for the Cyber Shield Platform with the following components and data flows the is File Analysis: A box labeled "File Analysis" connected to an external box labeled "Opswat" with the Opswat logo. Display multiple boxes or use parallel lines to symbolize scalability. Command and Control: A box labeled "Command and Control" shows incoming data from a switch and outgoing alerts towards the CAP. Include a Python logo and multiple instances to show scalability. Endpoint Agents: Numerous smaller boxes labeled "Endpoint Agents" around the perimeter, indicating scalability of the system. Network Forensics: A box labeled "Network Forensics" with incoming traffic data and outgoing data towards storage and indexed data towards the Text Search Engine. Show multiple boxes to indicate scalability. Cyber Automation Process (CAP): A central box labeled "CAP" shows incoming data from all components. Show multiple boxes or parallel lines to symbolize scalability. Investigation Portal: A box labeled "Investigation Portal" with bidirectional communication with the CAP. Show multiple boxes to indicate scalability. Databases: Boxes labeled with the respective database technology logos (MongoDB, Cassandra, Elasticsearch, BigQuery or Amazon Redshift). Show multiple boxes to indicate scalability. Message Broker: A box labeled "RabbitMQ" with the RabbitMQ logo, connected to all components that communicate with it. Show multiple boxes or parallel lines to symbolize scalability. Monitoring and Logging: Boxes labeled "Prometheus" and "ELK Stack" with their respective logos, connected to all components. Display multiple instances to show scalability. Deployment and Management Tools: Show Docker and Kubernetes symbols enclosing the system. Include the Istio service [...]

Prompt: technical illustration of numerous highly differentiated and detailed insect plant hybrids, earth tones, wallpaper --ar 1:1 --s 5000 --v 3
-

Prompt: A data stream.:: 2 Recreational lake. Data lake. Stream is full of data. Fish are the data. Lots of people. Boating. Carnival. Data. 35 degree angle. 4k High Resolution photograph. --ar 16:9 --chaos 0 --v 5 --q 1
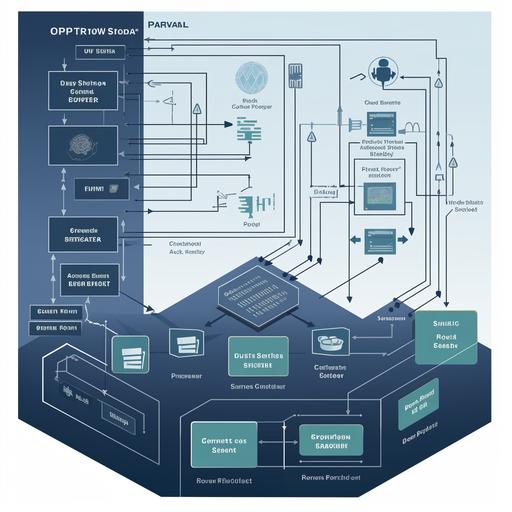
Prompt: a system architecture diagram for the Cyber Shield Platform with the following components and data flows the is File Analysis: A box labeled "File Analysis" connected to an external box labeled "Opswat" with the Opswat logo. Display multiple boxes or use parallel lines to symbolize scalability. Command and Control: A box labeled "Command and Control" shows incoming data from a switch and outgoing alerts towards the CAP. Include a Python logo and multiple instances to show scalability. Endpoint Agents: Numerous smaller boxes labeled "Endpoint Agents" around the perimeter, indicating scalability of the system. Network Forensics: A box labeled "Network Forensics" with incoming traffic data and outgoing data towards storage and indexed data towards the Text Search Engine. Show multiple boxes to indicate scalability. Cyber Automation Process (CAP): A central box labeled "CAP" shows incoming data from all components. Show multiple boxes or parallel lines to symbolize scalability. Investigation Portal: A box labeled "Investigation Portal" with bidirectional communication with the CAP. Show multiple boxes to indicate scalability. Databases: Boxes labeled with the respective database technology logos (MongoDB, Cassandra, Elasticsearch, BigQuery or Amazon Redshift). Show multiple boxes to indicate scalability. Message Broker: A box labeled "RabbitMQ" with the RabbitMQ logo, connected to all components that communicate with it. Show multiple boxes or parallel lines to symbolize scalability. Monitoring and Logging: Boxes labeled "Prometheus" and "ELK Stack" with their respective logos, connected to all components. Display multiple instances to show scalability. Deployment and Management Tools: Show Docker and Kubernetes symbols enclosing the system. Include the Istio service [...]

Prompt: wall clock-roman numerals on white dial, Wall Clock with Thermometer and Hygrometer,30cm diameter, bronze plastic frame,retro clock hands

Prompt: /a phone in the air with a few and really little digital data elements coming out from the phone, the data goes into a garbage can everything is blue and pink the background is really digital with blue and pink neon --v 6.0
-

Prompt: data grip logo
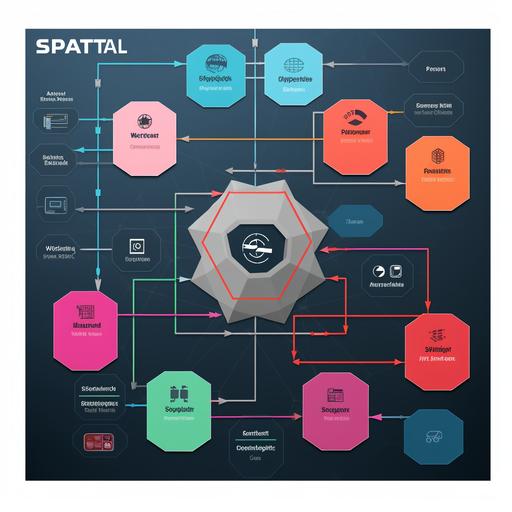
Prompt: a system architecture diagram for the Cyber Shield Platform with the following components and data flows the is File Analysis: A box labeled "File Analysis" connected to an external box labeled "Opswat" with the Opswat logo. Display multiple boxes or use parallel lines to symbolize scalability. Command and Control: A box labeled "Command and Control" shows incoming data from a switch and outgoing alerts towards the CAP. Include a Python logo and multiple instances to show scalability. Endpoint Agents: Numerous smaller boxes labeled "Endpoint Agents" around the perimeter, indicating scalability of the system. Network Forensics: A box labeled "Network Forensics" with incoming traffic data and outgoing data towards storage and indexed data towards the Text Search Engine. Show multiple boxes to indicate scalability. Cyber Automation Process (CAP): A central box labeled "CAP" shows incoming data from all components. Show multiple boxes or parallel lines to symbolize scalability. Investigation Portal: A box labeled "Investigation Portal" with bidirectional communication with the CAP. Show multiple boxes to indicate scalability. Databases: Boxes labeled with the respective database technology logos (MongoDB, Cassandra, Elasticsearch, BigQuery or Amazon Redshift). Show multiple boxes to indicate scalability. Message Broker: A box labeled "RabbitMQ" with the RabbitMQ logo, connected to all components that communicate with it. Show multiple boxes or parallel lines to symbolize scalability. Monitoring and Logging: Boxes labeled "Prometheus" and "ELK Stack" with their respective logos, connected to all components. Display multiple instances to show scalability. Deployment and Management Tools: Show Docker and Kubernetes symbols enclosing the system. Include the Istio service [...]

Prompt: Green little plant coming out of the earth with business network, Data analysis of financial and banking, Stock, AI, Technology and data connection, Security, Blockchain and Networking, Business strategy. --ar 7:4

Prompt: /a phone in the air with a few and really little digital data elements coming out from the phone, the data goes into a garbage can everything is blue and pink the background is really digital with blue and pink neon --v 6.0
-

Prompt: data grip logo
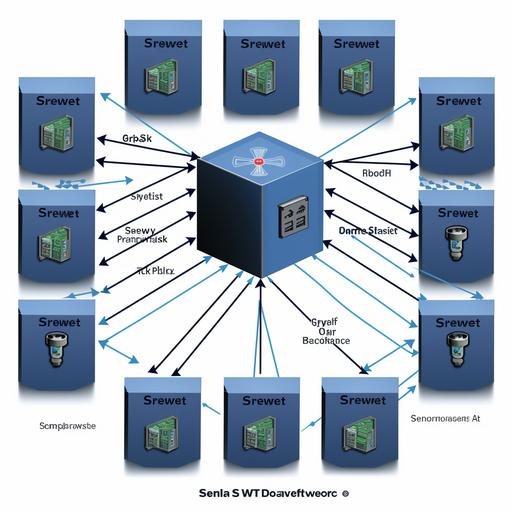
Prompt: a system architecture diagram for the Cyber Shield Platform with the following components and data flows the is File Analysis: A box labeled "File Analysis" connected to an external box labeled "Opswat" with the Opswat logo. Display multiple boxes or use parallel lines to symbolize scalability. Command and Control: A box labeled "Command and Control" shows incoming data from a switch and outgoing alerts towards the CAP. Include a Python logo and multiple instances to show scalability. Endpoint Agents: Numerous smaller boxes labeled "Endpoint Agents" around the perimeter, indicating scalability of the system. Network Forensics: A box labeled "Network Forensics" with incoming traffic data and outgoing data towards storage and indexed data towards the Text Search Engine. Show multiple boxes to indicate scalability. Cyber Automation Process (CAP): A central box labeled "CAP" shows incoming data from all components. Show multiple boxes or parallel lines to symbolize scalability. Investigation Portal: A box labeled "Investigation Portal" with bidirectional communication with the CAP. Show multiple boxes to indicate scalability. Databases: Boxes labeled with the respective database technology logos (MongoDB, Cassandra, Elasticsearch, BigQuery or Amazon Redshift). Show multiple boxes to indicate scalability. Message Broker: A box labeled "RabbitMQ" with the RabbitMQ logo, connected to all components that communicate with it. Show multiple boxes or parallel lines to symbolize scalability. Monitoring and Logging: Boxes labeled "Prometheus" and "ELK Stack" with their respective logos, connected to all components. Display multiple instances to show scalability. Deployment and Management Tools: Show Docker and Kubernetes symbols enclosing the system. Include the Istio service [...]

Prompt: green little plant coming out of the global business network, Data analysis of financial and banking, Stock, AI, Technology and data connection, Security, Blockchain and Networking, Business strategy. --ar 7:5

Prompt: /a phone in the air with a few and really little digital data elements coming out from the phone, the data goes into a garbage can everything is blue and pink the background is really digital with blue and pink neon --v 6.0